Start here
The research question behind this note.
Ask an NRI investor about a fund’s performance and you’ll get one number back: the average annual return. Ask about the worst stretch they’d have had to sit through to earn that return, and most people go quiet. That gap is exactly what maximum drawdown is…
Ask an NRI investor about a fund’s performance and you’ll get one number back: the average annual return. Ask about the worst stretch they’d have had to sit through to earn that return, and most people go quiet.
That gap is exactly what maximum drawdown is built to close. It isn’t a return number — it’s a pain number. It tells you the deepest peak-to-trough fall an investment, or your whole portfolio, has actually gone through in the real world, not on a spreadsheet. For NRIs building a portfolio across two or three currencies and time zones, it is arguably more useful for decision-making than the headline return ever will be.
Key Takeaways
- Maximum drawdown measures the largest peak-to-trough decline in an investment’s value — the worst point of pain, not the average outcome.
- A high average return with a large maximum drawdown can still mean years of your money sitting well below its previous high.
- Recovering from a loss takes disproportionately more gain than the loss itself — a 50% drawdown needs a 100% gain just to break even.
- Comparing maximum drawdown across asset classes (equity, debt, gold) helps NRIs judge whether a portfolio matches what they can actually tolerate.
- Drawdown alone says nothing about how long a decline lasted or how often it recurs — pair it with recovery time, not use it in isolation.
This article explains a risk-measurement concept used in portfolio analysis. It is educational information only, not investment advice or a recommendation to buy, sell, or hold any specific product.
What Is Maximum Drawdown, Exactly?
Maximum drawdown (MDD) is the largest drop an investment’s value has taken from a peak to the lowest point that followed, before it recovered to a new high. It’s expressed as a percentage, and the formula is straightforward:
Maximum Drawdown = (Trough Value − Peak Value) ÷ Peak Value
Here’s a worked example. Say your portfolio’s value moves like this over two years: ₹10,00,000 → ₹13,50,000 (a new peak) → ₹9,50,000 (the trough) → ₹14,00,000. The maximum drawdown is calculated from the peak of ₹13,50,000 to the trough of ₹9,50,000: (9,50,000 − 13,50,000) ÷ 13,50,000 = −29.6%.
It doesn’t matter that the portfolio went on to a new high afterward — the −29.6% is the worst dip you would have actually lived through along the way, and it’s the number that would have tested your patience (and possibly forced a bad decision) at the time.
Why Average Returns Can Quietly Mislead You
The math of losses and gains isn’t symmetric, and this is where a lot of investors get caught out. A loss requires a proportionally larger gain just to get back to even, because the base you’re recovering from has shrunk.
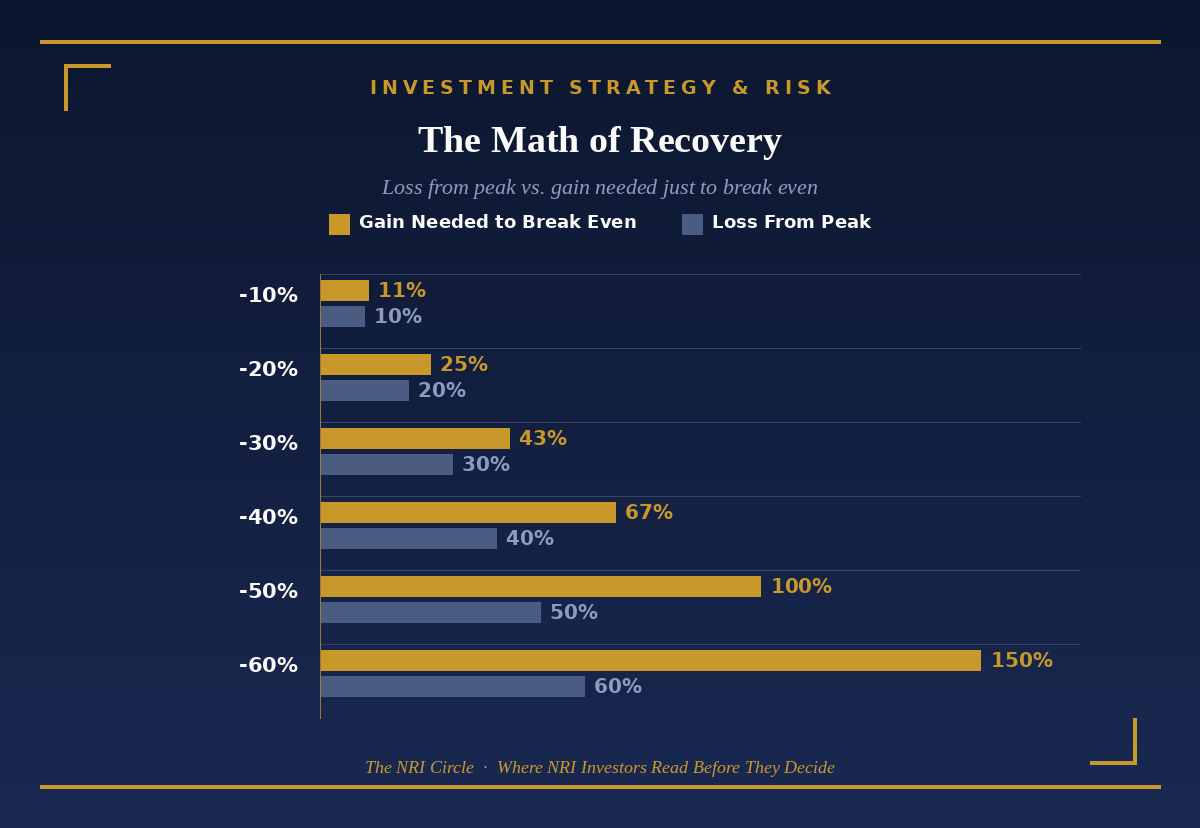
This is why two portfolios with the same average annual return can feel completely different to hold. One that grinds up steadily with shallow dips is a very different experience — and a very different recovery timeline if you need to withdraw — from one that swings wildly and happens to average out to the same number over ten years.
What Counts as a “Good” Maximum Drawdown?
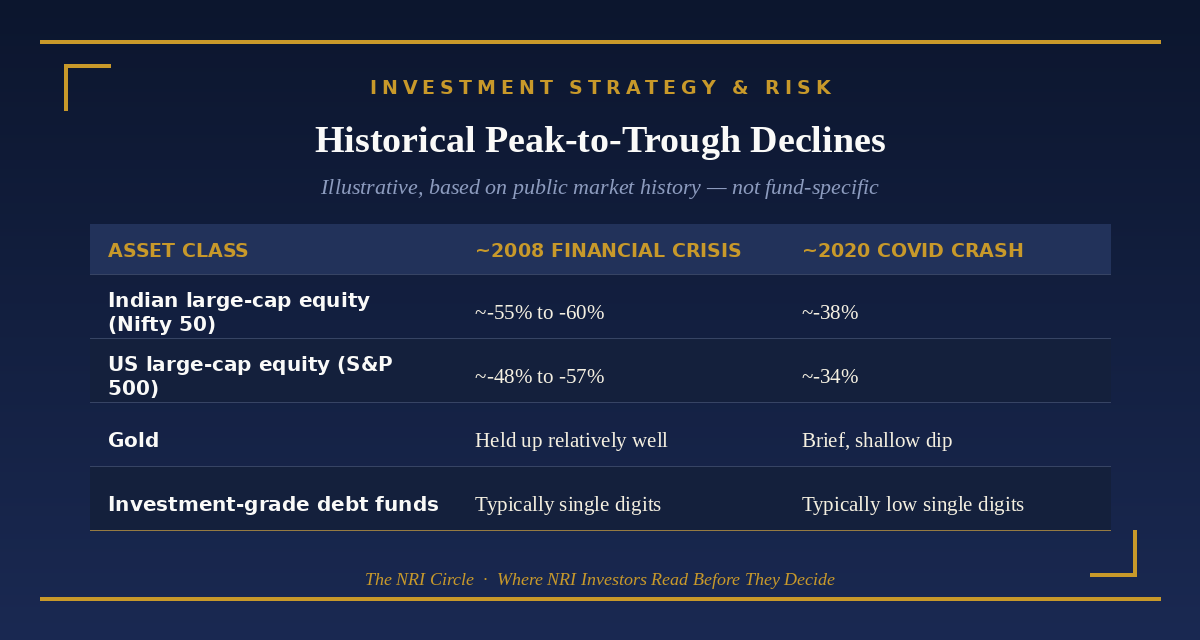
There’s no single answer — it depends entirely on the asset class and what you’re comparing against. As a rough, illustrative reference, here’s how some major asset classes have behaved during two of the sharpest global downturns in recent history:
Continue reading
Get the complete cross-border research note.
Unlock the remaining analysis, risk considerations and official-source references. Enter your name and email for immediate access. WhatsApp and country are optional; newsletter consent is separate and optional.
Official sources and the full research note are available after access is granted.