Start here
The research question behind this note.
Ask most investors what “risk” means and they’ll point to standard deviation — how much a fund’s returns bounce around. Ask a survivor of a real market crash, and they’ll point to something else entirely: how far their portfolio actually fell, and how long it took…
Ask most investors what “risk” means and they’ll point to standard deviation — how much a fund’s returns bounce around. Ask a survivor of a real market crash, and they’ll point to something else entirely: how far their portfolio actually fell, and how long it took to come back. Both are measuring risk. Neither one, alone, tells you the full story.
For NRIs comparing funds, PMS strategies, or their own portfolios across India and abroad, mixing these two up is one of the easiest ways to misjudge how risky something really is.
Key Takeaways
- Standard deviation measures how much returns bounce around their average — in both directions, up and down.
- Maximum drawdown measures the single worst peak-to-trough decline, regardless of how the rest of the ride felt.
- A portfolio can have low standard deviation and still carry a nasty drawdown risk if it’s normally calm but occasionally cracks hard.
- A portfolio can have high standard deviation and a comparatively shallow maximum drawdown if its swings are frequent but rarely extreme.
- Comparing funds on only one of these two numbers is a common way investors underestimate real risk.
This article explains two risk-measurement concepts used in portfolio analysis. It is educational information only, not investment advice or a recommendation to buy, sell, or hold any specific product.
Two Different Questions About Risk
Standard deviation answers: “On a typical day or month, how much does this investment’s return wander from its average?” Maximum drawdown answers a completely different question: “At the single worst moment, how much value did an investor actually lose from the peak?” You can build a portfolio that scores well on one and poorly on the other — which is exactly why relying on just one metric is dangerous.
What Standard Deviation Actually Measures
Standard deviation is a statistical measure of dispersion — how spread out a set of returns is around their average. A fund with a standard deviation of 8% has historically had returns that typically fall within a band of roughly plus or minus 8% of its average, most of the time. It treats a great month and a terrible month as contributing equally to “risk,” since both are deviations from the average.
What Maximum Drawdown Actually Measures
Maximum drawdown ignores the day-to-day wobble entirely and focuses on one specific, real event: the deepest fall from a peak to the lowest point that followed. It doesn’t care how smooth or bumpy the rest of the journey was — only how bad the worst single stretch actually got. We cover this in full detail, with a worked example, in our companion piece on maximum drawdown.
Curious how this applies to your situation? Ask us — it's free →
A Side-by-Side Example
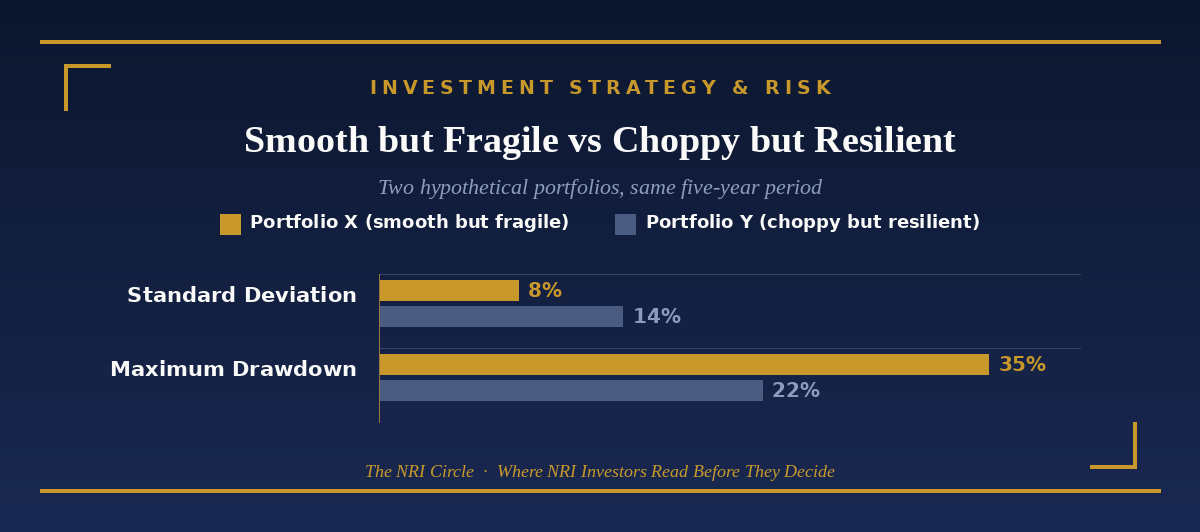
Consider two hypothetical portfolios over the same five-year period:
- Portfolio X (“smooth but fragile”): Standard deviation of 8% — it feels calm most of the time. But once, during a sharp market shock, it fell 35% from peak to trough.
- Portfolio Y (“choppy but resilient”): Standard deviation of 14% — it swings around noticeably more, month to month. But its worst peak-to-trough decline over the same period was only 22%.
Continue reading
Get the complete cross-border research note.
Unlock the remaining analysis, risk considerations and official-source references. Enter your name and email for immediate access. WhatsApp and country are optional; newsletter consent is separate and optional.
Official sources and the full research note are available after access is granted.